
In this article:
- Introduction
- Crawler statistics dashboard
- Using filters
- How long did it take for search engines to crawl your changes?
- Which pages have not been crawled yet?
Introduction
The RankSense dashboard contains a crawl log that records the visits of common bots, including search engine bots.
Using just the filters on the dashboard, you can see what pages a search engine has crawled most recently, or look up particular pages.
When used in combination with tags, the dashboard can show you how much time passed between when you published a change and when that change was crawled.
If you have made important changes, but the pages have not been crawled yet, you can manually submit them to be crawled using Google Search Console.
Crawler statistics dashboard
The crawler statistics can be found on the main dashboard when you scroll down.

Using filters
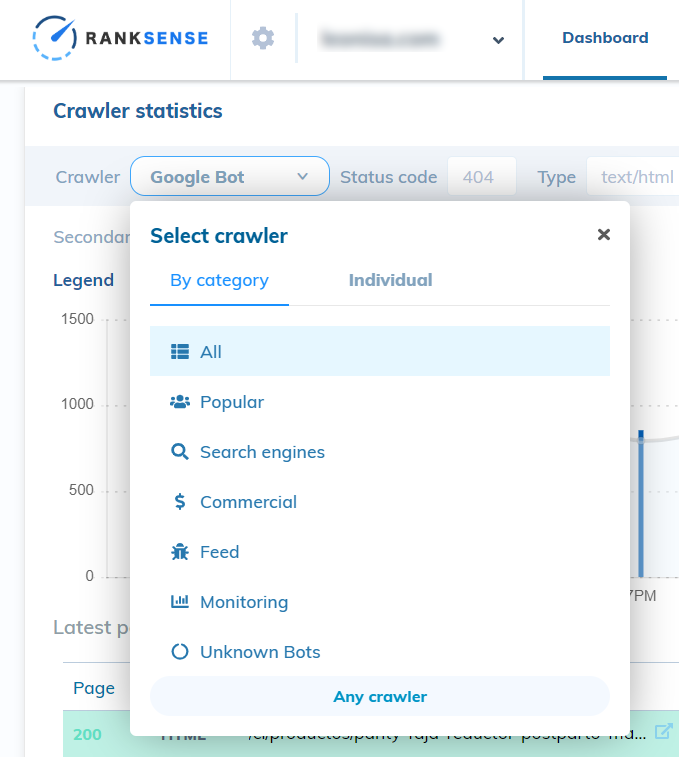
You can use the “Crawler” selector at the top to choose a type of bot (i.e. search engine bots) under the “By category” menu or a particular bot under the “Individual” menu.
You can filter for a particular URL using the “Search in URL” feature. Enter the text you would like to filter URLs by, then click “Apply.”

This will allow you to check the last time any page was crawled.
However, what if you want to see how long it has been since you published a change? Or if you want to see a group of pages that you have applied a tag to?
How long did it take for search engines to crawl your changes?
When you filter by a tag, the dashboard changes slightly. It will tell you how much time passed from when a change was published to when a search engine bot crawled that change. This can be important for A/B tests or for tracking changes that were implemented outside of RankSense because it will let you know whether a major search engine has seen your change or not.
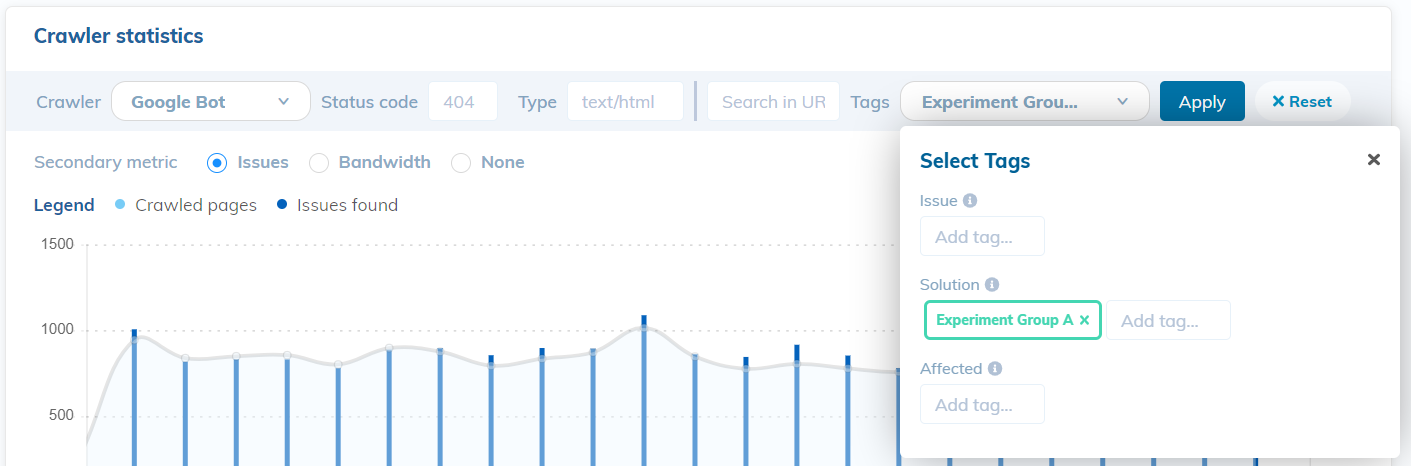
Click the “Tags” filter and it will display the three types of tags (issues, solutions and affected). Each of these will display the tags that are in use on the site. Choose the one you would like to check. You may also wish to select a crawler.
Now, the dashboard displays “Last published” and “First crawl delay” columns. The “first crawl delay” is the amount of time that passed from when the change was published to when the page was crawled.

This functionality can be extended for other purposes. For example, if you have opted to use tagging to tell RankSense what type of pages are on the site, you will be able to filter by page type using the “affected” tags. This will allow you to see how recently all pages of a certain type have been crawled. It can also display their search clicks and their page status (i.e. 404 status).
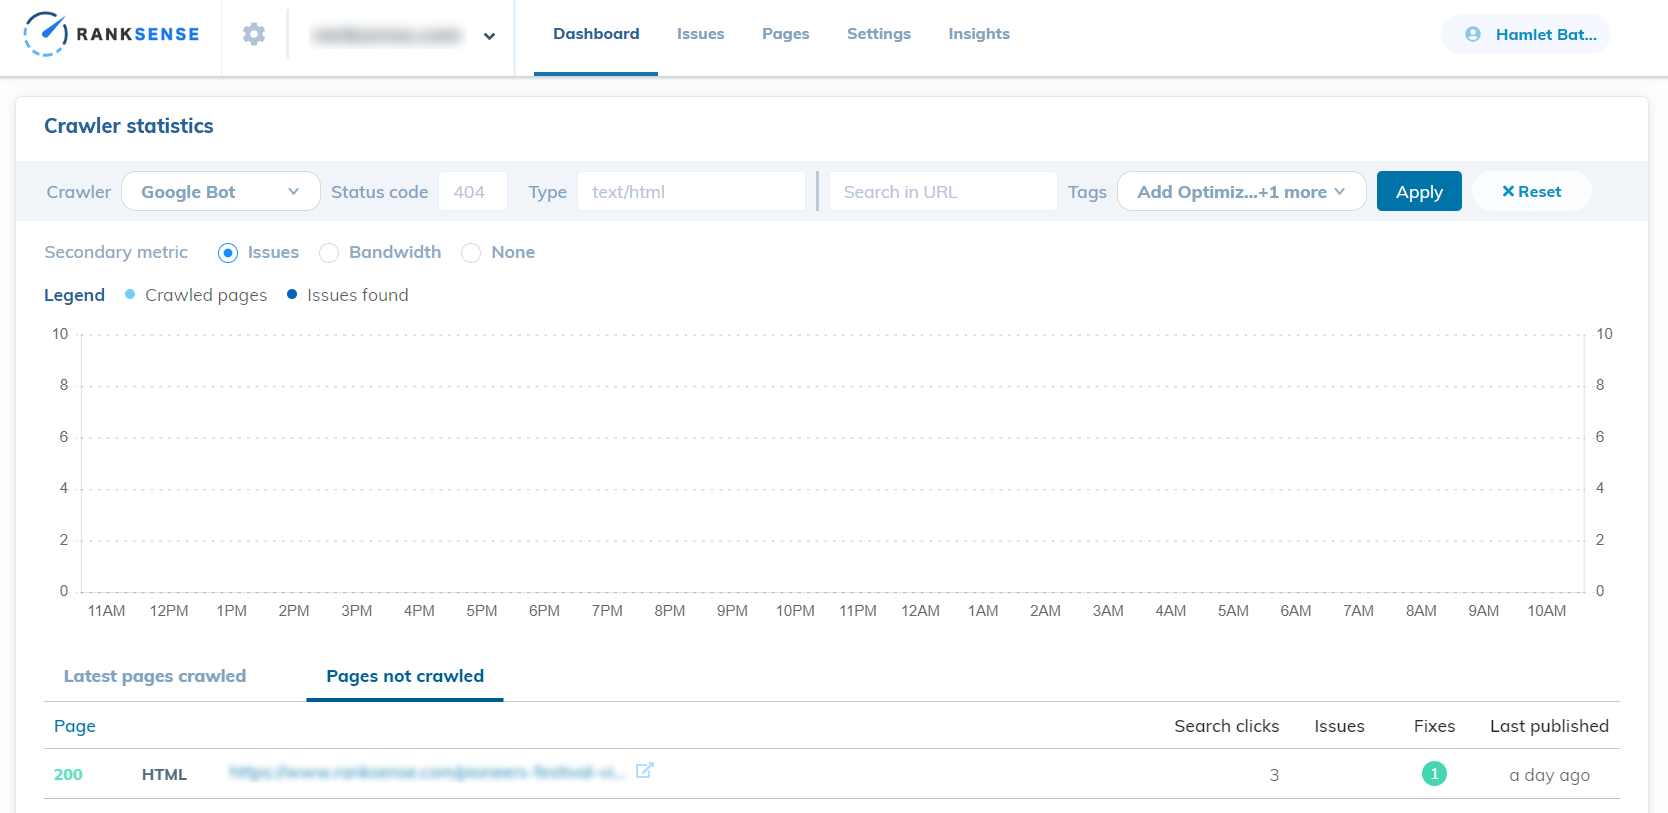
What pages have not been crawled yet?
When you have filtered the dashboard for a tag, “Pages not crawled” will show above the URL list. Switch to this tab to see a list of pages that have not been crawled since you published a change. You can also select the crawler.
This is very handy if you have published changes and are wondering when to start checking the pages’ performance.
If you still have pages that have not been crawled by Googlebot, you can submit them in Google Search Console using the URL inspection tool.